Pipeline Monitoring
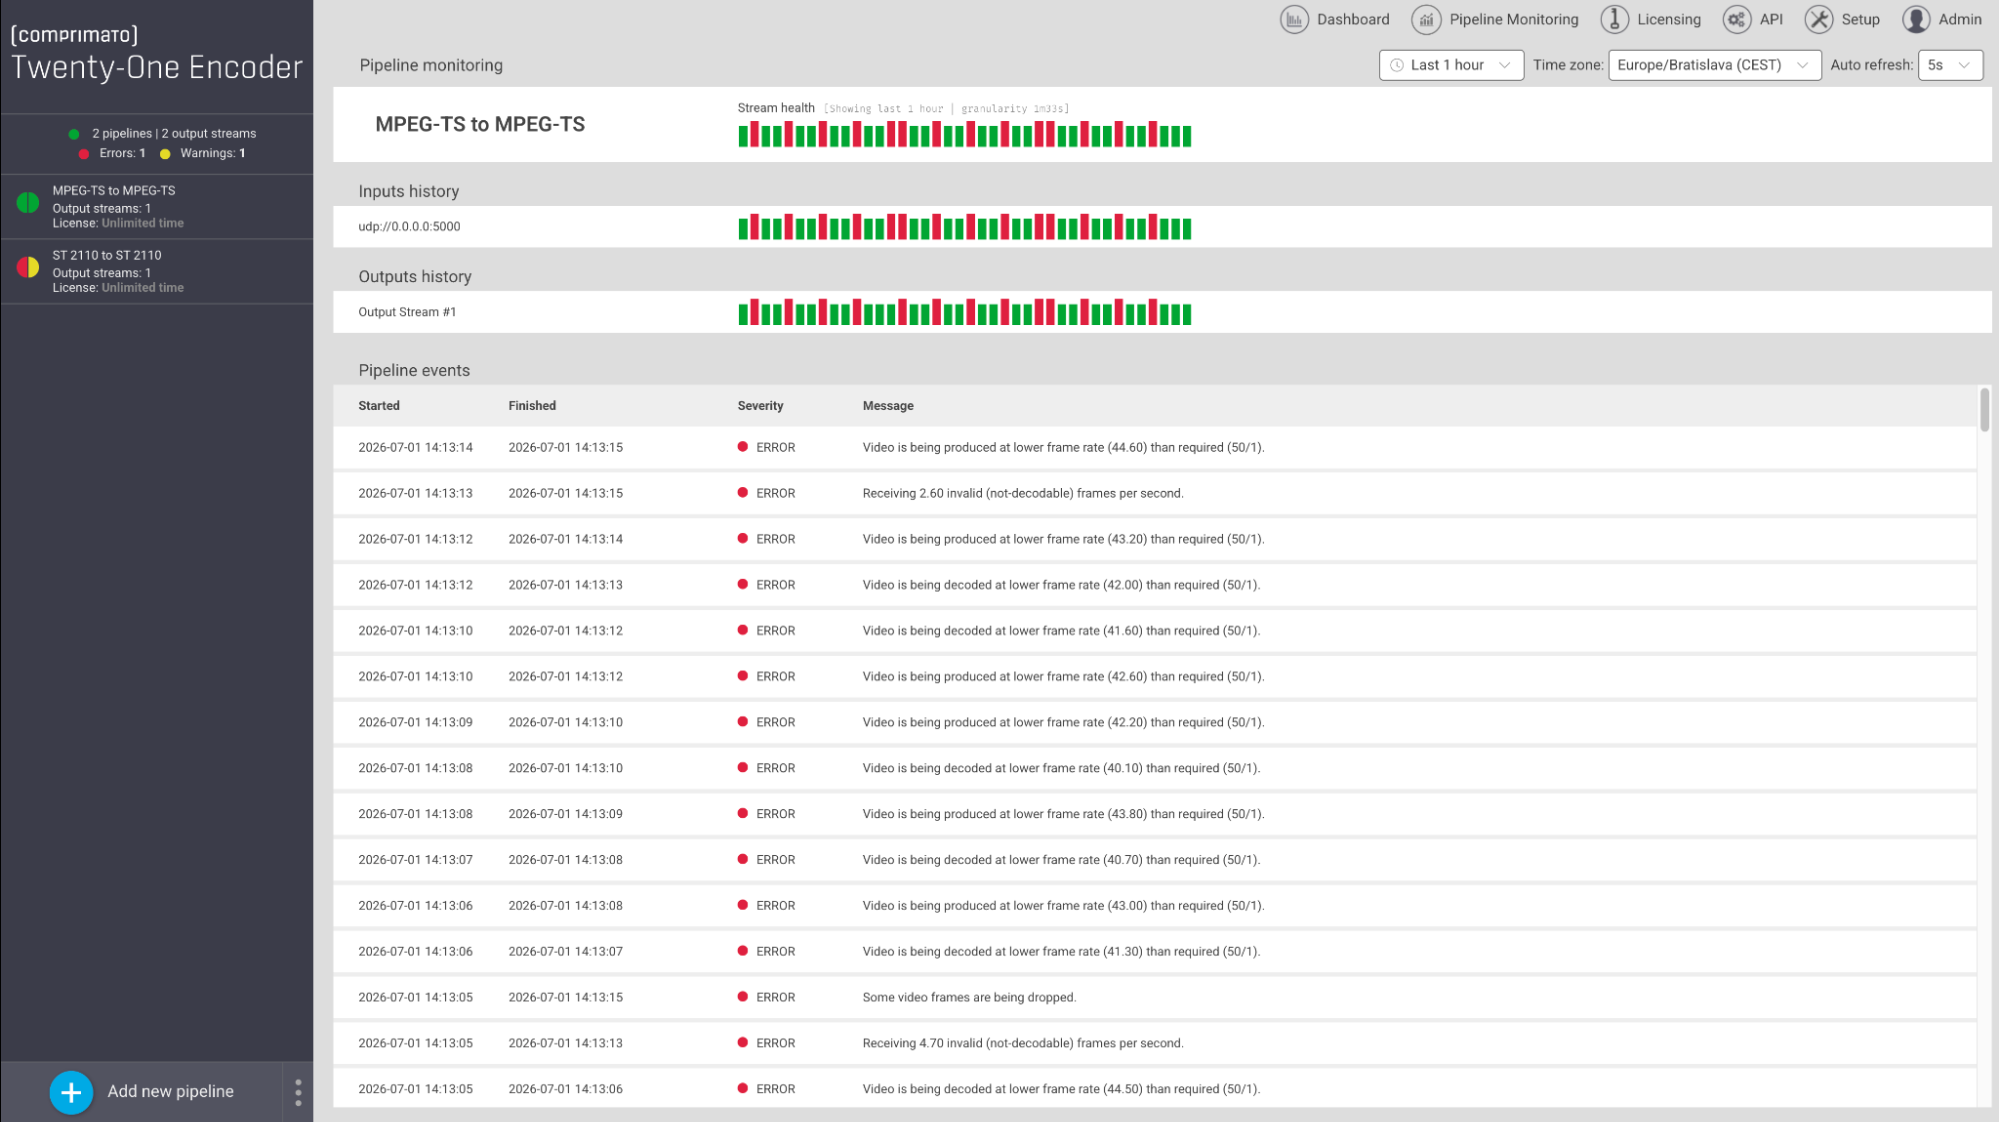
The Pipeline Monitoring section has two pages: an overview of all pipelines and a pipeline detail page.
Common controls
These controls appear on every page in the section:
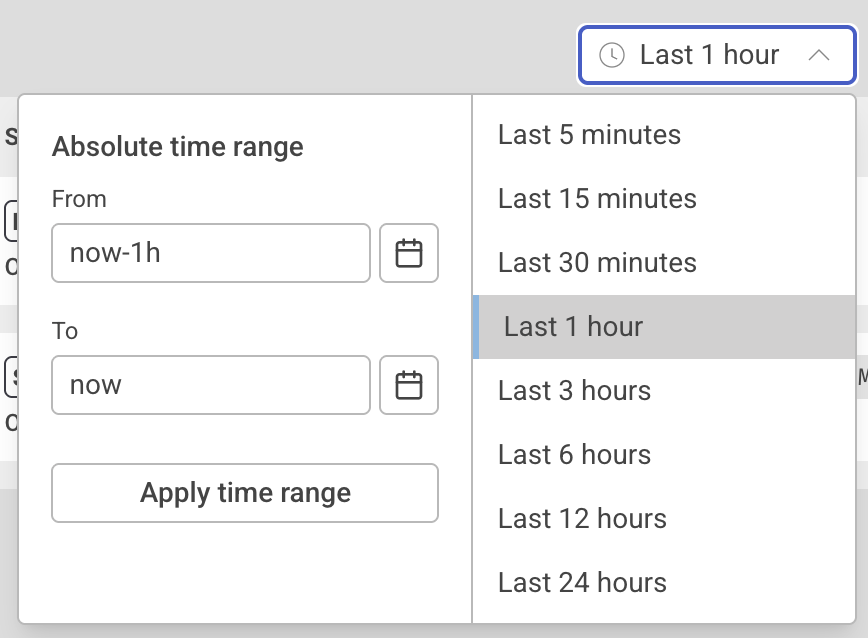
- Time range — Sets the time range for all time-series data (the health charts and the pipeline events table). It also determines how much time each bar in the health charts covers: the wider the range, the more time each bar spans. You can choose either a relative or an absolute range. A relative range is built from the keyword
now, optionally followed by a minus sign and a duration written asNfollowed by a time unit—s,m,h,d, w, oryfor seconds, minutes, hours, days, weeks, or years—whereNis a positive integer (for example,now-1h). Absolute ranges can be picked from the date picker or entered manually in the format YYYY-MM-DD HH:MM:SS (note the space between the date and the time).
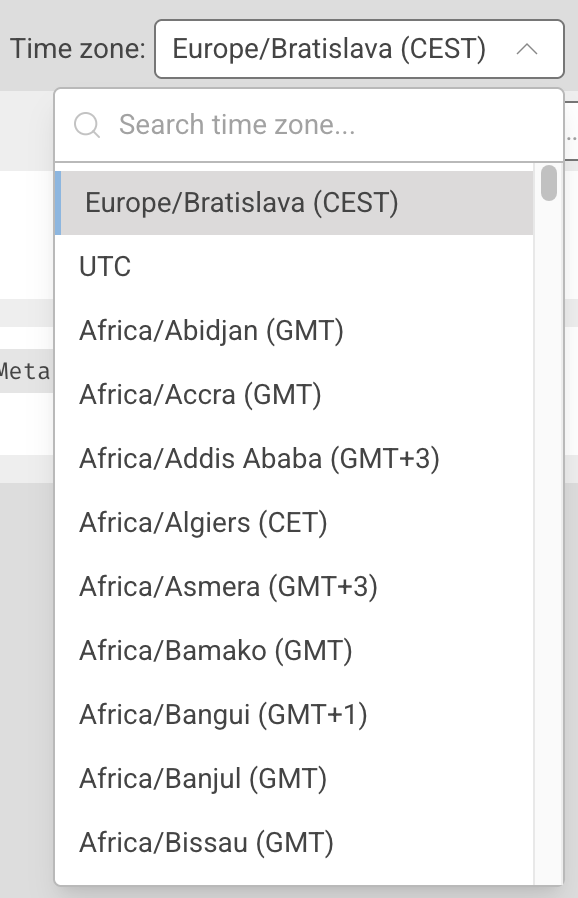
- Time zone — Sets the time zone, with an autocomplete search to help you find one quickly.
- Auto refresh — Sets how often the data reloads automatically, and can also be turned off.
Health chart
A health chart is a bar chart showing the health state of a pipeline or stream over time. Each bar covers a fixed span of the selected time range, and hovering over a bar shows the time that span begins. This span length is the chart's granularity, and it's derived from the selected time range — a wider range means each bar covers more time. For example, a 5-minute range produces bars of roughly 8 seconds each, while a 1-hour range produces bars of roughly 93 seconds each. The current granularity is shown in two places: after "Stream health" in the overview table header, and above the overall pipeline health chart on the detail page.
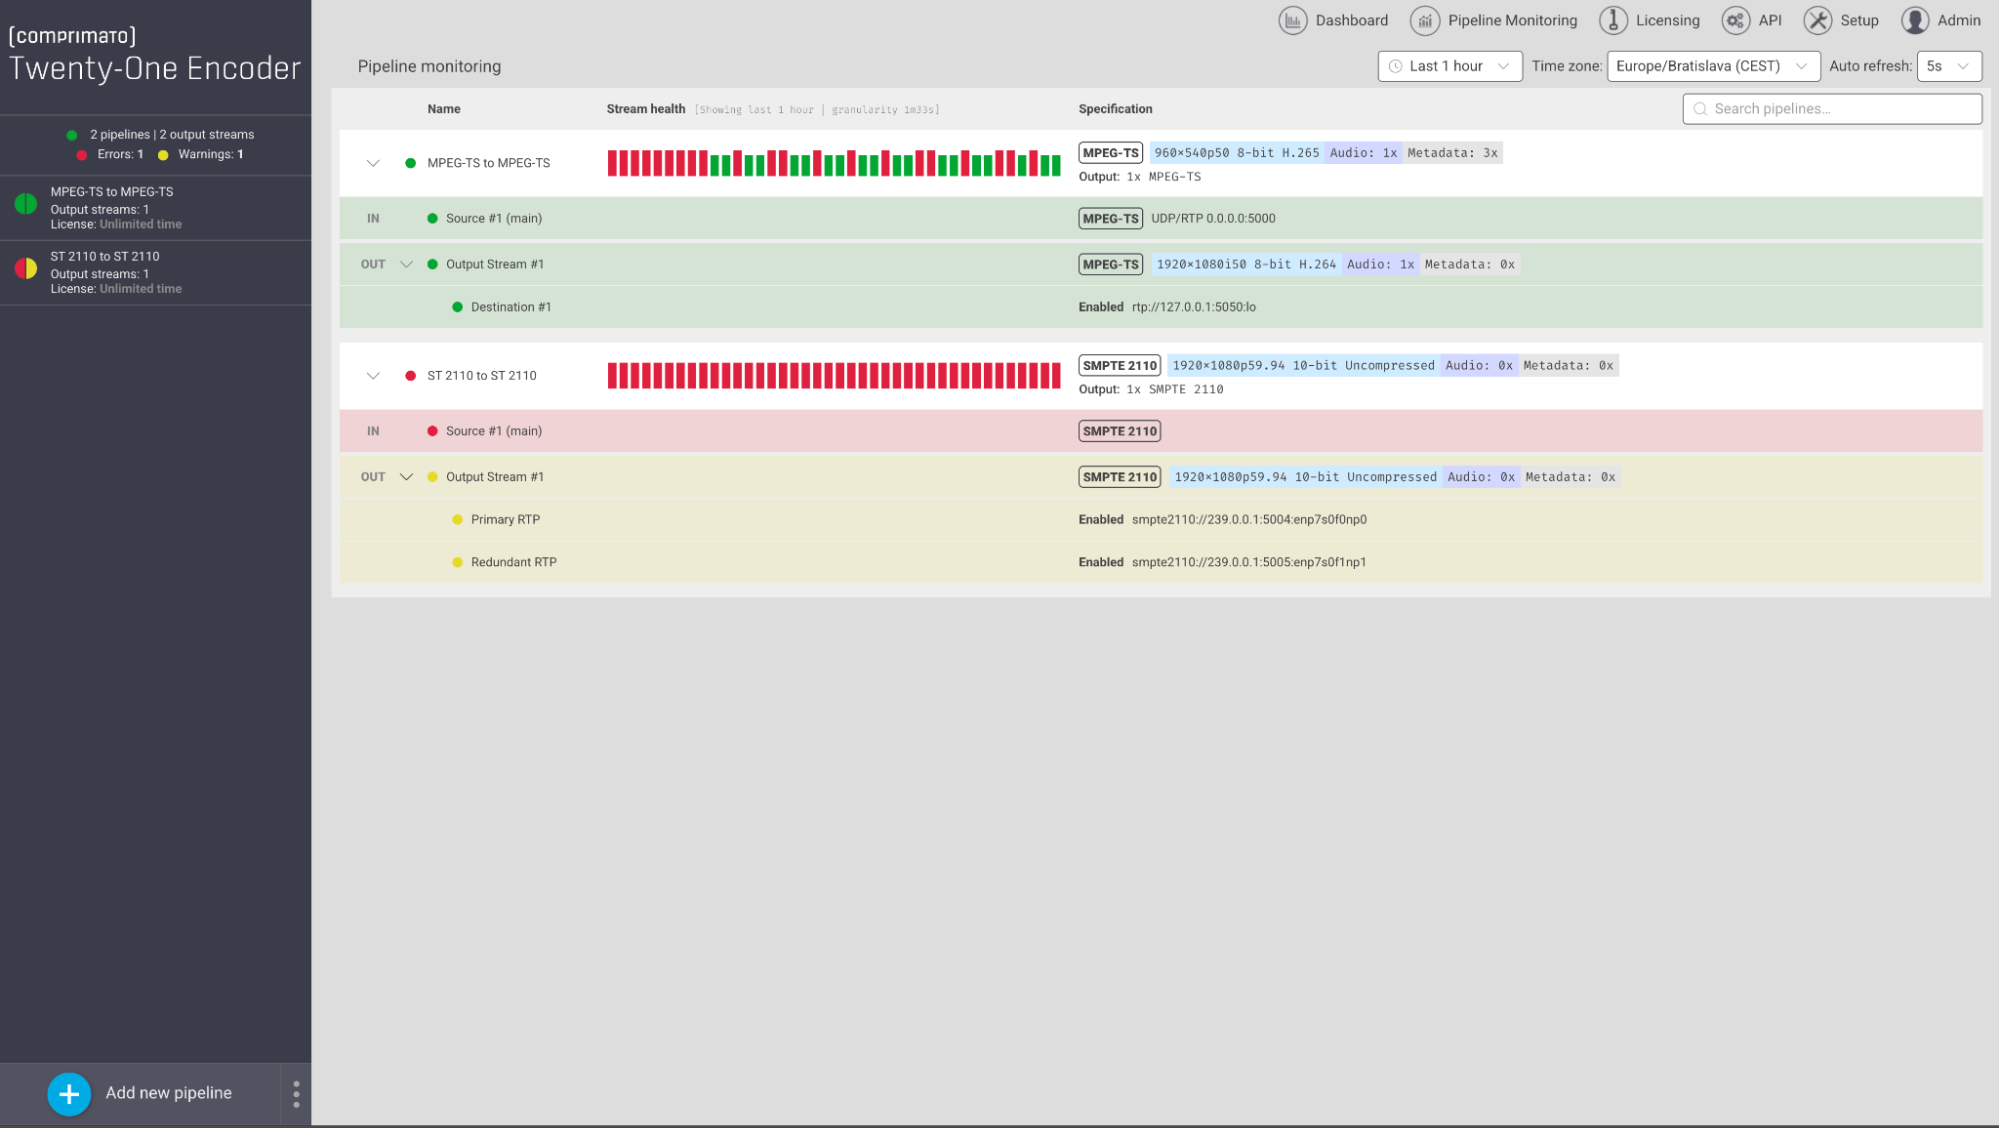
Overview page
Pipelines are listed in a table, one per row, with each row showing the pipeline's name, health chart, and specification. Expanding a pipeline row reveals its input and output streams as their own rows, and expanding an output stream row shows all of that stream's destinations. A circular status dot next to each name indicates the real-time health of the pipeline or stream; for input and output streams, the row's background color reflects the same state. Clicking a pipeline row opens its detail page.
Pipeline detail page
This page shows information about a specific pipeline, identified by its name in the top left. It displays several health charts—one for the pipeline's overall health, plus one for each input and output stream—and, below them, a table of pipeline events.
Each event has a time range in which it occurred, a severity, and a text message. Its Started or Finished timestamp may show N/A, meaning the event began or ended outside the selected time range. If the range's To value is set to now and the Finished timestamp is N/A, the event is still ongoing.